Network Monitoring System


Background
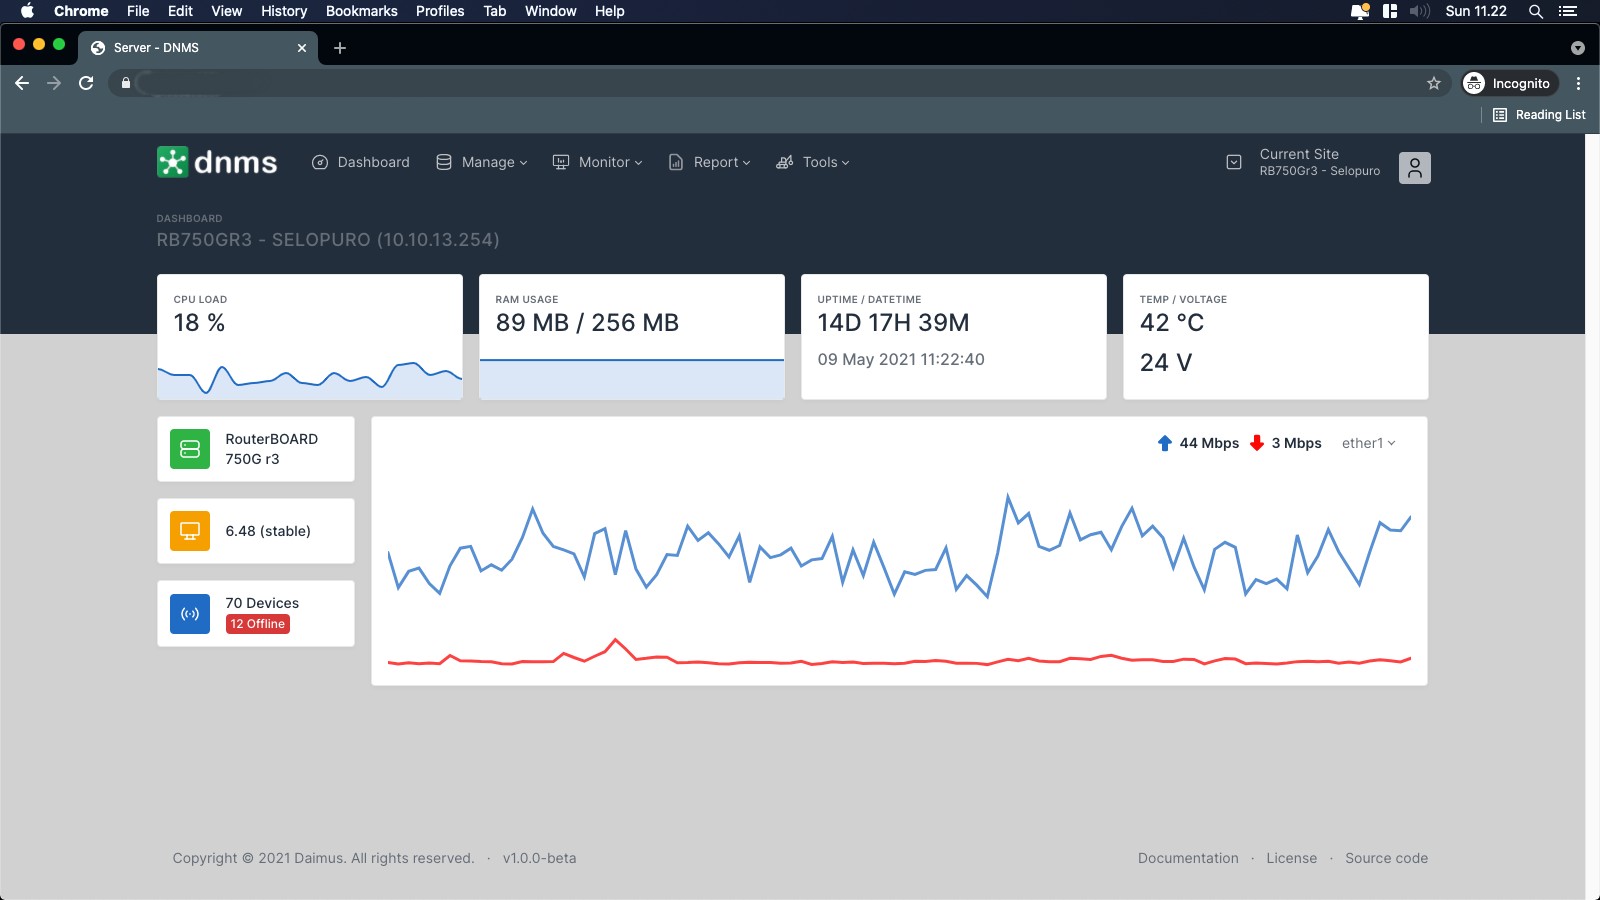
Managing hundreds of client networks with various devices and connection types was a challenge. Whenever an issue occurred, I had to manually trace and analyze datasets one by one, which was time-consuming and inefficient. To solve this, I built a network monitoring system that visualizes networks using topology and map views. This allows me to instantly identify where issues are occurring, making network management faster and more effective.
Challenge 1: How I Gather Device Metrics
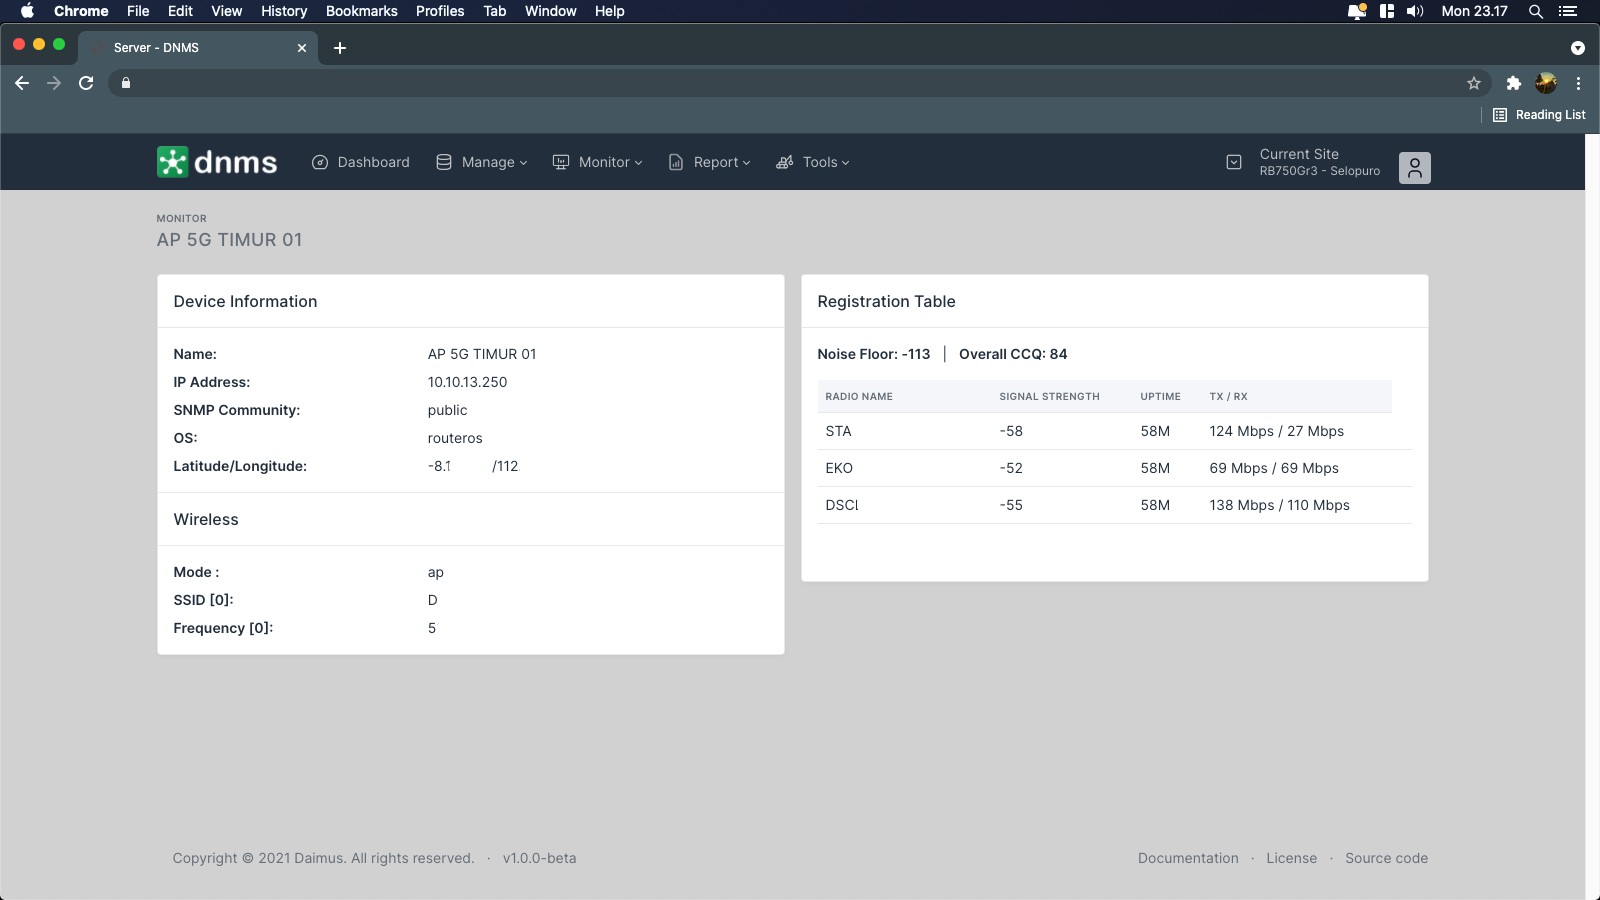
To effectively monitor a large-scale network, I needed a way to retrieve real-time data from each device, including connected clients, signal strength, CCQ, and latency. Since my setup primarily consists of MikroTik and Ubiquiti devices, I had to find the best method to extract this information from both brands.
For MikroTik, the process was relatively simple. MikroTik provides a well-documented API, making it easy to access and retrieve network data. By integrating the API into my system, I could directly fetch the necessary metrics without any major hurdles.
Ubiquiti, on the other hand, was a different challenge. Unlike MikroTik, I couldn’t find an official API that offered the same level of access. To work around this, I looked for a universal solution that would be compatible with various network devices. That’s when I explored SNMP (Simple Network Management Protocol).
SNMP turned out to be the perfect fit. It allowed me to retrieve key device metrics such as signal strength, latency, and connected clients, regardless of the device brand. After testing, I confirmed that SNMP worked seamlessly with Ubiquiti devices, enabling me to gather real-time data just as I did with MikroTik.
By combining the MikroTik API and SNMP, my system became capable of monitoring both brands efficiently, ensuring a consistent and reliable way to track network performance across all connected devices.
Challenge 2: SNMP Standardization
After choosing SNMP as a universal solution, I encountered a major challenge—standardization. Even within the same brand, different models or device types sometimes had variations in data structures or query responses.
Fortunately, for Ubiquiti devices, the required data was mostly consistent, so I didn’t face significant issues. However, I realized that with other brands, SNMP implementations might differ, making my method potentially incompatible.
To maintain reliability, I decided to officially support only MikroTik RouterOS-based and Ubiquiti AirOS-based devices in this monitoring system. Since I didn’t have access to other brands for testing, I left this limitation unresolved, acknowledging that it could be a potential issue in the future.
Challenge 3: Delivering Real-Time Data
As a network monitoring system, real-time data delivery was a top priority. I needed a solution that could push updates instantly rather than relying on periodic polling. After some research, I decided to use WebSocket.
Why WebSocket?
WebSocket was the ideal choice because:
- Low Latency: Unlike traditional HTTP polling, WebSocket maintains a persistent connection, reducing delay and ensuring real-time updates.
- Efficient Data Transfer: It only transmits changes instead of reloading the entire dataset, minimizing bandwidth usage. Open and close connection may increase CPU/Memory usage too.
- Bidirectional Communication: WebSocket allows both the client and server to send data instantly without repeatedly opening new connections.
The monitoring system establishes a persistent WebSocket connection between the dashboard client and the server. The server continuously gathers network data from MikroTik (via API) and Ubiquiti (via SNMP). Whenever new data is available or a significant change is detected, the server pushes updates to all connected clients instantly. This event-driven approach ensures that if a device goes offline, experiences high latency, or encounters a critical issue, users receive immediate notifications, allowing them to take swift action.
Challenge 4: Making It Work Online
Some key functions of this monitoring system, like pinging and checking device liveness, require direct network access. Running it locally was simple, but what if I needed to access the system online from anywhere? The obvious solution was to host it on a server.
However, this introduced a new challenge—how would the server communicate with devices in a local network? Since these devices were behind NAT or firewalls, direct access wasn’t possible.
Fortunately, my networking knowledge from school helped me find a solution: creating a tunnel between the server and the main gateway of the local network. This tunnel allowed the system to securely reach local devices as if it were inside the network. Surprisingly, this solution also solved another problem—I could now remotely access local devices within sub-networks, making management much easier.
Looking back, I never expected this journey to take me this far, but every challenge led to a valuable learning experience.
I Know It’s Not Perfect
This monitoring system was built with limited knowledge and resources, so I acknowledge that it’s not as advanced as other solutions like UniFi Network Server or The Dude. One of the biggest weaknesses is the initial setup—it requires manual network configuration and device registration, which can be tedious and time-consuming. Every device must be added one by one, making the first setup quite painful.
However, over time, I found an unexpected benefit. Since each device is individually registered, troubleshooting becomes much easier. If a specific network section goes down, I can quickly identify and isolate the issue without relying on complex automation that might obscure the root cause.
Another limitation is the lack of extensive device support and built-in actions. Unlike enterprise-grade monitoring tools that provide deep integration with various brands and automated management features, my system only supports MikroTik and RouterOS-based Ubiquiti devices. Additionally, while it effectively monitors network status, it doesn’t offer advanced control functions, such as remote firmware updates or automated recovery mechanisms.
Despite these weaknesses, the system still serves its purpose well for my needs. Over time, there’s always room for improvement, whether by expanding device compatibility or making the setup process more user-friendly.
It’s Open Source
When I shared this project in an online forum and invited people to try it, I was thrilled by the positive response. It was shared and commented on hundreds of times, and I was happy to see that many others faced similar network challenges and found my work helpful.
Seeing the enthusiasm, I decided to make the project open source so anyone could use, modify, and improve it according to their needs. The repository, github.com/daimus/dnms, has received dozens of stars and forks, showing that this tool has real value for the community.
What I Learned
Building this network monitoring system has been a huge learning experience. Initially, I just wanted to solve my own problem—managing hundreds of networks efficiently—but along the way, I gained deeper insights into networking, real-time data processing, and system deployment.
One of the biggest lessons was understanding data collection methods. While MikroTik’s API was straightforward, Ubiquiti required a different approach. Learning how to use SNMP as a universal solution was a game changer, though I also realized the challenges of standardization across different device models and brands.
Another key takeaway was real-time data delivery. Researching different technologies led me to WebSocket, which turned out to be the perfect choice for low-latency, bidirectional communication. This helped me build a system that pushes updates instantly instead of relying on inefficient polling methods.
Deploying the system online introduced a new challenge—remote access to local networks. I had to create secure tunnels between the server and local gateways, which not only solved the connectivity issue but also gave me a new way to manage sub-networks remotely.
Lastly, the most rewarding lesson was the power of community and open source. When I shared my project online, I realized that many others faced the same issues I did. The positive feedback and contributions encouraged me to open-source the project, turning it into something that others could improve and benefit from as well.
This journey has taken me far beyond what I initially expected, and I’m excited to keep learning and improving the system over time.